How to create an infographic design


Table of contents

Wondering how to convey complex information or overwhelming data in a more engaging way? Infographic design is the solution! Through the use of color, design, and a strong narrative, infographics will have a greater impact than just text or raw data. It's a sophisticated and modern way to share insights and educate readers in an engaging way.
But, wait a minute... What is an infographic? And how do you create an infographic?
In this article, we'll walk you through what an infographic is and the important steps in creating an infographic design that is not only eye-catching, but also meaningful. We'll teach you how to choose the right template, combine colors harmoniously, and organize data in a way that is easy to digest.
What are Infographics?
Infographics comes from the English words; “Information” and “Graphics.” Literally, infographics are information packaged in a visual way that is used to convey information in a more interesting way. With a combination of text and some visual elements such as images, illustrations, graphs, and even typography, infographics are great at conveying complicated info into something that is easier to understand.
Therefore, don't be surprised if you find examples of infographics all over social media, research reports, business presentations, and school assignments in the classroom. It's a sign that infographics have become a visual communication tool that is not only engaging, but also makes it easier for all of us to understand a topic or data.
Benefits of Infographics

Infographics, a simple yet effective concept, have revolutionized the way we convey information. Now that we understand what infographics are, let's dive deeper into the benefits of engaging infographic images for your business:
1. Conveying Information More Effectively
Infographics transform complex information and data into compelling visuals. With these visuals, complex information can be simplified, allowing readers to grasp the key points quickly.
2. Increase Website Traffic
Infographic images are not only pleasing to the eye, but they can also increase traffic to your website. Visual content will attract more attention, and people will be more likely to share it, resulting in more traffic to your website.
3. Strengthens Digital Marketing Effectiveness
With their ability to go viral, infographics increase the exposure of your information, products or services. The messages you convey through infographics will tend to be more engaging and have the potential to reach more audiences through social media.
4. Makes Content Sharing Easy
Infographics will allow your content to be shared easily, which is of course important for a digital marketing strategy. Eye-catching visual images make people want to share them, which can increase your brand's reach and visibility.
5. Build Backlinks to Website
Infographics can generate significant backlinks to your site, which is important for SEO. Content with infographics will tend to get more inbound links and views than content without infographics.
6. As a Content Marketing Asset
Infographics are a valuable asset in content marketing. With their visual appeal, infographics will attract attention and can support your content marketing strategy.
7. Increase Brand Awareness
Professionally created infographics can increase your audience's brand awareness of your product. Don't forget to include your brand logo in the design!
8. Helps SEO
Useful and informative Infographic images often get backlinks from other sites, which will be invaluable for your SEO efforts. Remember, engaging content equals clicks!
9. Increases Reading Interest
Interesting visuals in infographics make people more interested in reading the information you present. Professional graphic design can cultivate the audience's interest in reading.
10. As a Promotional Media
Simple and to-the-point visual content, such as infographics, is preferred by internet users. The delivery of promotions through infographics can be more effective.
Types of Infographics

This captivating visual tool can be transformed into many different forms. Let's find out what are some popular types of infographics that can spice up your information dish!
1. Statistical Infographics
Statistical infographics are images that show statistical data information. This is perfect for those who want to present survey results or data from various sources. This type of infographic helps you present data in a way that is not only informative, but also visually appealing.
2. Timeline Infographics
Want to tell a story about a historical journey or the date of an important event? You can use this type of timeline infographic. Since we tend to understand time visually, this type of infographic can help convey chronology in a clearer and more interesting way.
3. Process Infographics
When you want to explain a process step by step, this process infographic can be your best bet. The simple design and clear flow, from left to right or top to bottom, makes each step easy to understand. This is a great example of how infographics can make processes easier to understand.
4. Geographic Infographics
Have data related to location or demographics? Geographic infographics are a great choice. Using maps as the main focus, this type of infographic brings your location or demographic data to life in a visually appealing form.
5. Comparison Infographic
Can't decide between several options? This type of comparison infographic helps clarify the choice by comparing objects with each other. With clear separation and contrasting colors, this infographic will make it easier to compare and choose.
6. Hierarchical Infographics
Ordered from largest to smallest, or vice versa, this hierarchical infographic is the best. It's perfect for those who want to visualize an organizational structure or highlight priority levels.
7. Summary / Summarization Infographic
Similar to a resume, this infographic provides a visually appealing summary. While it can't completely replace the typical resume, it can be a powerful weapon during a job interview or when introducing your portfolio.
However, creating an engaging infographic is not just about the design. You need to understand and define your audience, collect relevant data and references, and use the right data visualization methods. And don't forget, an attractive grid layout and template will reinforce the message you want to convey. These are the basics on how to create effective and engaging infographics.
How to Make an Infographic
Now that we know what the benefits of infographics are, it's time to start creating them. But before getting into the design stage, there are a few things you need to pay attention to.
1. Define Purpose and Audience
First and foremost, determine the topic of the infographic. You can take a topic that is currently trending or that has high relevance to your target audience. Think, “What do I want to convey to the reader?” and “Who will be looking at this piece?” Remember, knowing your audience is very important! For example, if your audience is teenagers, then a contemporary design and light text could be the right choice.
2. Collecting Data and References
Now, it's time to collect data and references. Accurate and relevant information is very important in infographics. You can use data from various sources, such as the internet, books, or your own research. Importantly, don't forget to include the source of the data!
3. Choose a Suitable Template
Next, choose an image template that suits your content. There are many online tools like Canva or Venngage that provide cool templates. You can also take reference from Pinterest for infographic design. Feel free to tweak the template to suit your needs.
4. Data Visualization with ICCORE
Well, here we use the ICCORE method (Inform, Compare, Change, Organize, Relationships, and Explore). ICCORE can help you choose the most appropriate type of diagram to present your data. So, you can choose whether to use a bar graph, pie chart, timeline, and so on, according to the purpose of your infographic.
5. Attractive Design with Grid Layout
It's time to make all the elements in your infographic neat and attractive by using a grid layout. Remember, a good layout guides the reader's eye from one element to another smoothly. So, make sure your layout is easy to follow and pleasing to the eye!
6. Add Interesting Text
Infographic images are not just about images or graphics. Text is also important to provide context or additional information. Make your text short, concise, and easy to digest. Choose a simple font and the right size, so that your text is easy to read and doesn't distract from the aesthetics of your design.
7. Review and Revise
Once you've finished creating all the elements of your infographic, always review and revise. Check again if there is any incorrect data or information, or perhaps the design needs to be refined. This stage is very important to ensure that the infographic is presented in the most attractive form possible. These are the basics on how to create effective and engaging infographics.
Recommended Free Infographic Processing Website Platforms
Infographics are a form of content that you can now create even if you're not a professional. It's time to get rid of your confusion in finding complicated infographic design tools. You can use the platforms below to create fun infographics:
1. Canva - “The King of Templates”
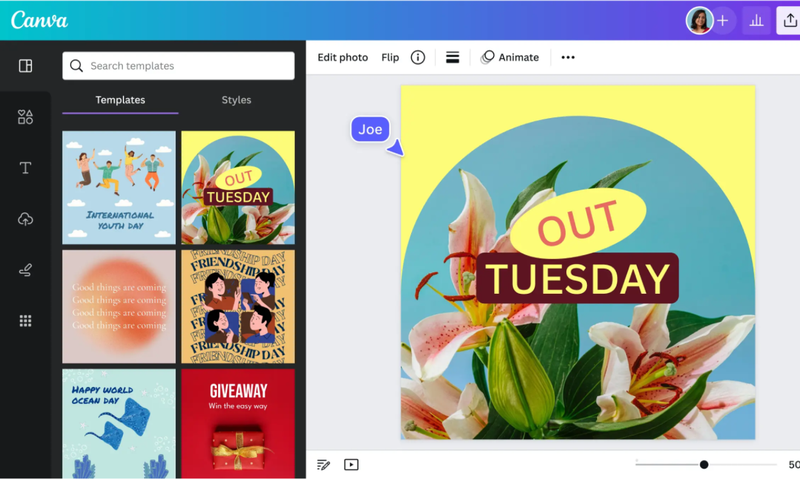
Canva is an all-in-one solution for stunning infographic designs. With its drag-and-drop feature, Canva makes it simple to create infographics, even for beginners. There are plenty of infographic examples to inspire you, and it's easy to add images and other design elements.
2. Piktochart - “The Easy Infographic Maker”

Piktochart offers an easy-to-use tool for creating informative and engaging infographics. With a variety of customizable design options, Piktochart allows you to turn your ideas into creative and effective infographics.
3. Visme - “The Professional's Choice”
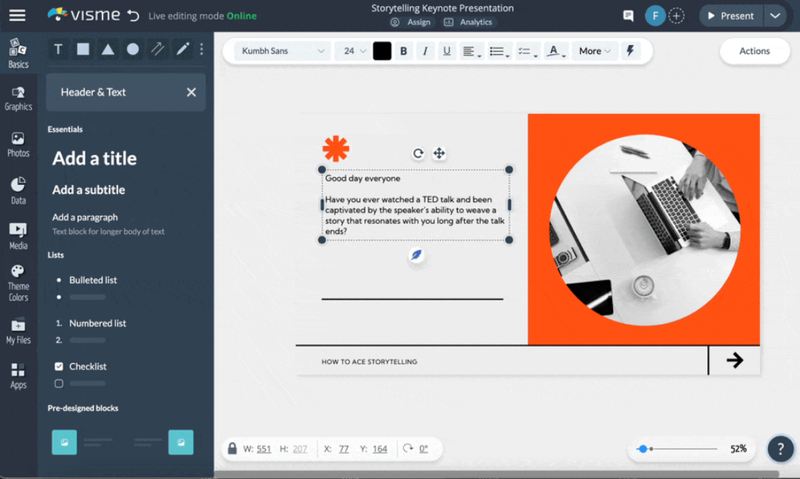
Visme is an ideal choice for professionals who want to create infographics with a more sophisticated look. The platform provides customizable templates, analytics tools, and the ability to integrate data in real-time.
4. Easel.ly - “Simple But Charming”
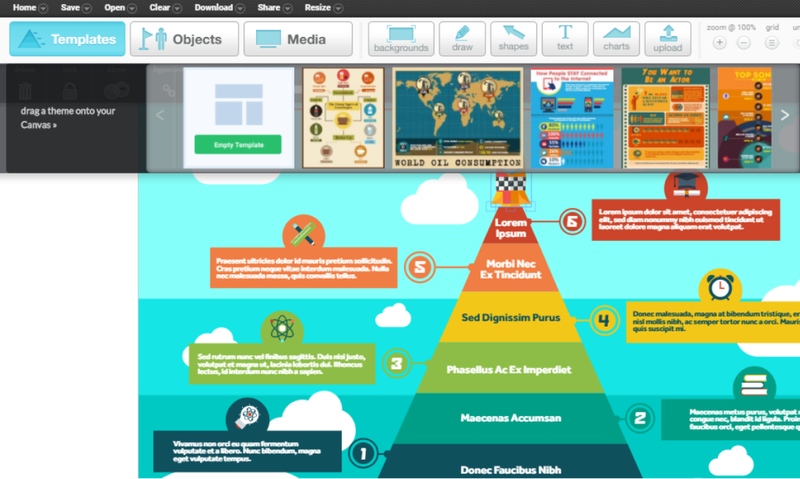
Easel.ly allows you to create infographics in a simple, yet captivating way. With a variety of easy-to-use templates, Easel.ly is the perfect place to start for those who are just learning to create infographics.
5. Venngage - “Fun Infographic Creator”
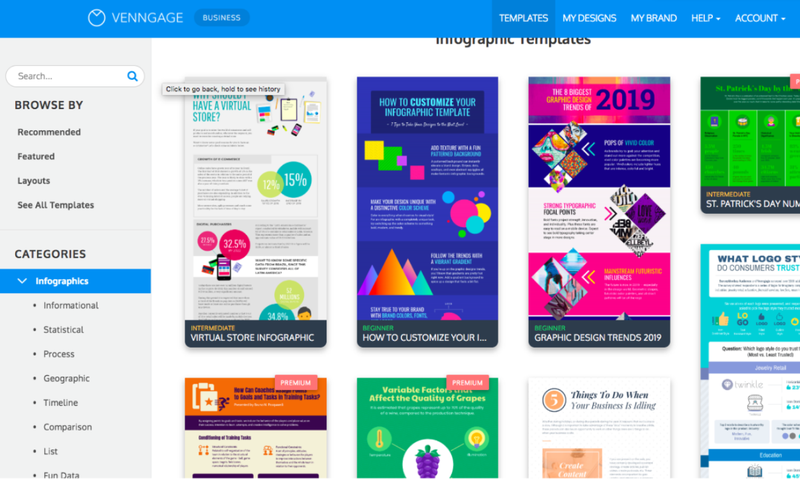
Venngage provides a fun way to create infographics with a variety of interactive and animated templates. It is an ideal platform for those who want to create infographics that are not only informative, but also engaging and entertaining.
6. Adobe Creative Cloud Express - “Designers' Choice”

If you want a more professional infographic design platform, choose Adobe Creative Cloud Express. This platform offers powerful tools and you can also integrate with various other Adobe software, making it a favorite choice for designers for graphic image creation.
7. Lucidpress - “Professional Infographics”

Lucidpress is a great choice for those who need a flexible and professional design solution. This platform is perfect for creating infographics and other promotional materials with a clean and professional look.
8. Snappa - “Amazing Design for Beginners”

Snappa is an ideal choice for graphic arts beginners. With a user-friendly interface and access to a wide range of stock images, Snappa will ease the process of creating eye-catching infographics.
9. Animaker - “Video Formatted Infographics”
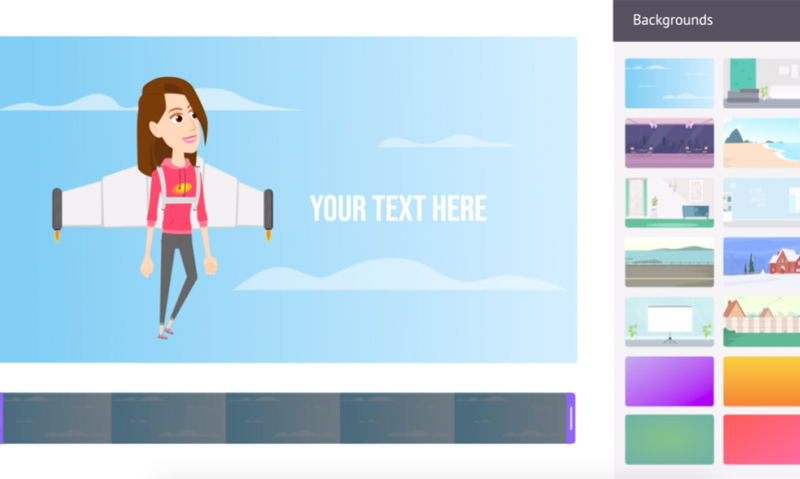
Animaker offers a unique way of creating infographics, which is in video format. This platform is perfect for those who want to present data or stories in a more dynamic and engaging way.
10. PicMonkey - “The King of Photos in Infographics”

PicMonkey provides powerful image editing tools, which allow you to combine images with infographic elements. It is the perfect solution for integrating photography into infographic design.
With these various platforms, you can choose the best way to create an infographic that suits your needs and design style. From simple infographic examples, to more complex designs, you can create them easily and effectively. Good luck!
Conclusion
We've explored the meaning and benefits of infographics. We've also seen the different types and examples, and uncovered the secrets behind creating effective infographics.
With our recommendations for free infographic creation websites, you can create infographics even without the help of a professional designer. Platforms like Canva and Piktochart have become the go-to best sellers in the world of infographics, offering stunning and easy-to-use illustrations.
Last but not least, sites like Skola and Whello offer additional resources and guidance on infographics, including in the context of legal and professional communications.


Comments 4